Cut Crawl Waste with a 4 Step Log File Analysis for SEO Engineers

Log file analysis for SEO means reading your server’s raw request records to see exactly what search engine crawlers did on your site, request by request, instead of guessing from sampled crawl tools. The immediate payoff is accuracy: you find crawl waste, indexing blind spots, and post-migration regressions that Google Search Console and third-party crawlers simply can’t show you. It matters most for large ecommerce catalogs, sites mid-migration, and JavaScript-heavy builds where rendering and crawling diverge.
TL;DR:
- Log file analysis reveals actual crawl frequency and response times of search engines, particularly beneficial for sites with large catalogs or during migrations.
- Verifying crawler authenticity requires a two-step process: matching user agents and confirming IP addresses through reverse and forward DNS lookups.
- Grouping traffic by URL patterns and parameters helps identify slow or crawled pages that are overlooked in standard crawl reports, enabling targeted fixes.
- Retaining logs for at least 30 to 90 days allows tracking crawl behavior over time and evaluating the impact of site updates or migrations.
- Automating log collection and analysis through warehouses or dedicated tools accelerates identifying crawl waste, redirect issues, and orphan pages for faster SEO optimization.
Table of Contents
- What Makes Log File Analysis Different From Crawlers and GSC?
- How Do You Collect Server Logs for SEO Analysis?
- How Do You Filter Out Fake Bots From Real Crawler Traffic?
- What’s the Step-by-Step Workflow for Analyzing Log Data?
- What Problems Does Log Analysis Reveal, and How Do You Fix Them?
- Which Tools Should You Use, Based on Site Size?
- What Should You Check After a Site Launch or Migration?
- How a growth engineering partner builds log analysis into a growth engineering roadmap
- When Should You Actually Prioritize Log File Analysis?
- How a growth engineering partner turns log data into shipped fixes
- Sources
- FAQ
What Makes Log File Analysis Different From Crawlers and GSC?
Every crawler tool and every Search Console report is a summary. Server logs are the source record. They capture every request to your server, including exactly which bot hit which URL, when, and what your server returned, which is fundamentally different from what a simulated crawl or a sampled GSC report tells you.
That distinction matters in three specific situations. First, scale: once a site passes a few hundred thousand URLs, sampled data starts hiding patterns that only show up when you look at total request volume. Second, migrations: you need to confirm Googlebot actually found your new URLs and stopped requesting the old ones, and no crawler simulation can tell you what really happened on your server last Tuesday. Third, slow or stalled indexing: when pages sit in “Discovered, not indexed” for weeks, logs often reveal the real cause, whether that’s a crawl budget problem, a response time issue, or a bot that never showed up at all.
Logs answer three operational questions no other tool answers directly. How often does each search engine actually crawl a given URL or template? What status codes are crawlers really encountering, as opposed to what a once-a-week crawl tool sampled? And how fast is your server responding to those requests, because response timing signals compound at scale and can shift how much crawl budget Google allocates to you.
Think of GSC as your dashboard and a crawler like Screaming Frog as your simulator. Logs are your flight recorder. You don’t need the flight recorder every day. You need it after something goes wrong, or when you’re flying a plane too big to eyeball from the cockpit.
How Do You Collect Server Logs for SEO Analysis?
Most servers write logs in one of three common formats: the Apache/Nginx combined log format, the W3C extended format used by IIS, or a structured JSON/CSV export from a CDN or cloud platform like Cloudflare, Fastly, or AWS CloudFront. If your site sits behind a CDN, you’ll often need to pull logs from two places, the CDN edge and the origin server, since a lot of crawler traffic gets served from the edge and never touches your origin at all.
Getting the files themselves usually means one of three routes: asking your hosting or DevOps team for direct access, pulling exports from your CDN’s dashboard, or setting up a log push to cloud storage (S3, GCS) on a schedule. Expect rotated and gzipped files. A typical setup rotates logs daily and compresses anything older than a day, so your collection process needs to handle .gz extraction as a standard step, not an edge case.
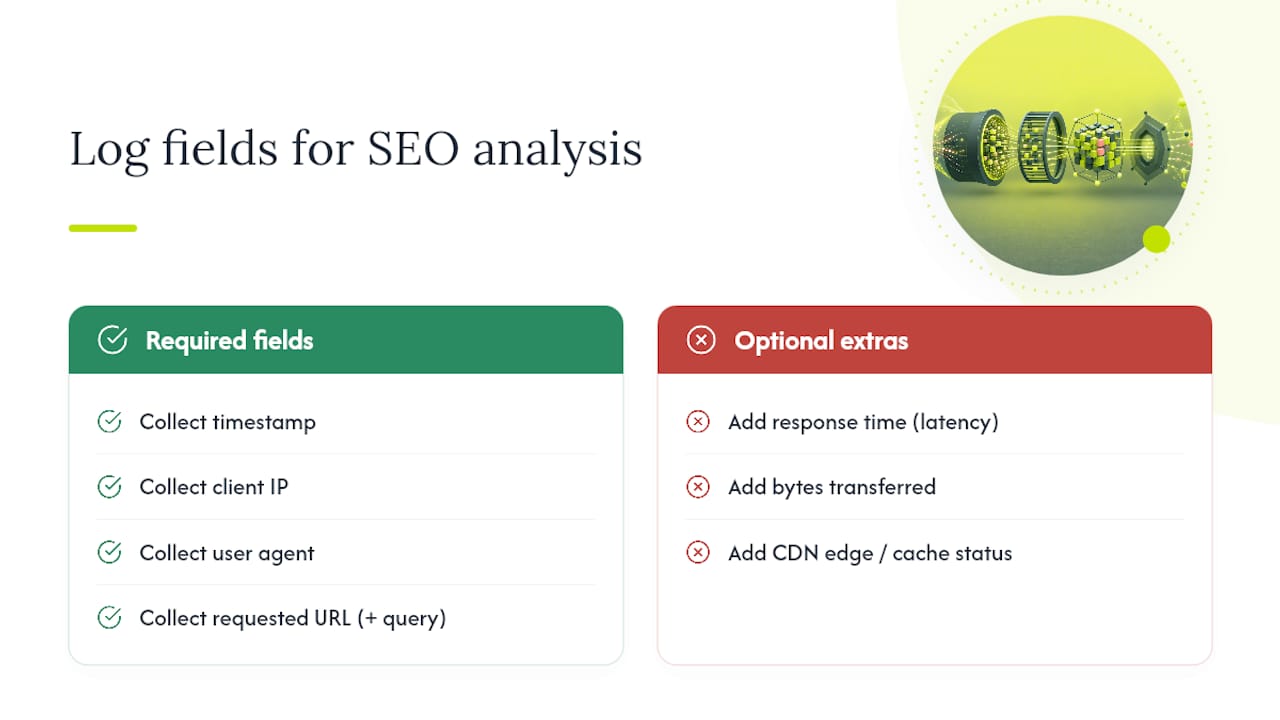
For SEO analysis, you need five fields at minimum: timestamp, client IP, user agent, requested URL (with query string), and HTTP status code. Beyond that minimum, a few extra fields pay for themselves quickly. Response time (or request latency) tells you where crawlers are hitting slow endpoints. Bytes transferred helps you spot soft 404s and abnormally large or small responses. If you’re pulling from a CDN, the edge location or cache status field tells you whether a request even reached your origin server, which changes how you interpret origin-side logs entirely.
On retention: keep at least 30 days of raw logs, and 90 days when possible. Thirty days gets you a baseline crawl pattern. Ninety days gets you something more valuable, a real before-and-after comparison across a migration, a redesign, or a algorithm-driven crawl shift. Once you’ve validated a workflow, ship logs to a storage bucket or a proper warehouse rather than relying on whatever your host retains by default, because most hosting providers purge raw logs far sooner than 90 days.
How Do You Filter Out Fake Bots From Real Crawler Traffic?
User agent strings are trivially easy to fake. Any scraper, spam bot, or curious competitor can set their user agent to “Googlebot” and your logs will show a lie unless you check further. Filtering by user agent string alone tells you what a request claims to be, not what it is.
The fix is a two-step verification most SEO teams skip because it feels like extra work, until the first time a spoofed-bot spike wrecks their crawl-frequency chart:
- Filter by user agent first to isolate anything claiming to be Googlebot, Bingbot, or another known crawler, using a simple string match or regex against your log’s user agent field.
- Verify with reverse DNS lookup on the source IP. A real Googlebot request resolves back to a hostname ending in
googlebot.comorgoogle.com. - Confirm with a forward DNS lookup on that resolved hostname, checking that it maps back to the original IP. This closes the loop and catches spoofers who fake the reverse record too.
- Cross-check IP ranges against the published IP blocks Google and Bing publish for their crawlers, as a fast secondary check for high-volume analysis where per-request DNS lookups are too slow.
A quick command-line pass looks something like grep "Googlebot" access.log | awk '{print $1}' | sort -u, which pulls unique IPs claiming to be Googlebot so you can spot-check them against verified ranges before trusting the rest of the file.
Separate mobile and desktop crawler traffic explicitly, since Google’s mobile-first indexing means the mobile Googlebot user agent is the one that matters for most sites now. Normalize the data before you analyze it: strip protocol and host duplication (http versus https, www versus non-www), decide up front whether tracking parameters get stripped or grouped, and standardize trailing slashes so /products/shoes and /products/shoes/ don’t split into two rows. Any traffic that fails DNS verification but claims to be a search engine gets discarded from your crawler dataset entirely. It’s not Googlebot. Treat it as generic bot or spam traffic and move on.
What’s the Step-by-Step Workflow for Analyzing Log Data?
Once your logs are clean and verified, the analysis itself follows a fairly consistent sequence: collect, filter for verified bots, group by URL pattern, then cross-reference against a site crawl and Search Console to find the gaps that actually matter.
Start with four core metrics for every verified crawler hit:
- Hits per URL and per directory, to see where crawl attention concentrates
- Status code distribution (200s, 301s, 404s, 500s) across the same groupings
- Average response time per URL group, flagging anything materially slower than your site median
- Bytes transferred, which helps catch soft 404s that return a 200 status but a near-empty page
Raw URL-level data is too granular to act on directly. Group requests by template (product pages, category pages, blog posts), by directory (/blog/, /products/, /help/), and by parameter pattern (?sort=, ?color=, ?sessionid=). This grouping step is where the real insight shows up. A single slow product template hit 40,000 times a month is a bigger problem than 40,000 individual slow requests scattered randomly.
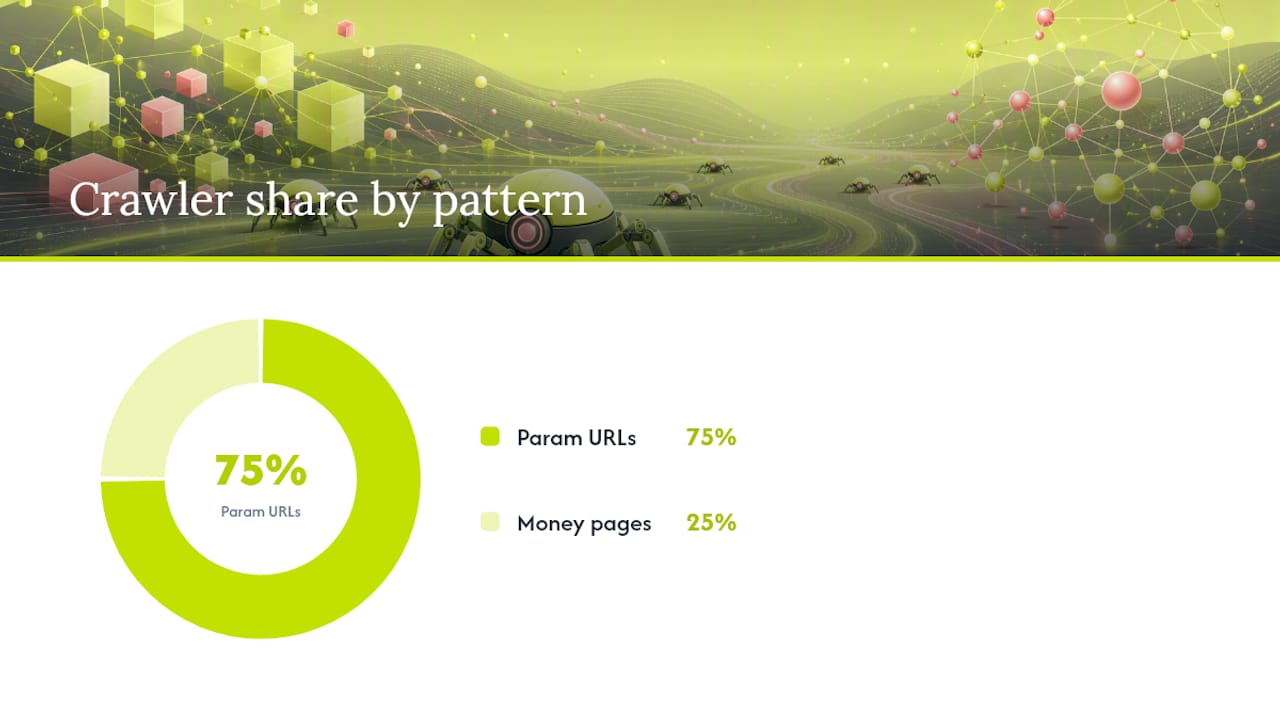
Statistic worth internalizing: on large sites, faceted filters, session parameters, and duplicate mobile URLs routinely consume a disproportionate share of crawler activity, while pages you actually want ranked get crawled far less often. You won’t see this imbalance in a monthly crawl report. You see it when you sum request volume by URL pattern and the parameterized junk outweighs your money pages three or four to one.
The cross-referencing step is what turns a spreadsheet of hits into a prioritized fix list. Pull your site crawl (Screaming Frog, Sitebulb, or similar) and your GSC index coverage export, then join all three datasets on URL. This surfaces pages that Google is crawling frequently but never indexing, pages your crawl found but your logs show almost no bot visits to (orphan pages, effectively), and pages GSC lists as indexed that your logs show haven’t been recrawled in months.
Prioritize fixes with a simple heuristic: impact times frequency. A high-value page crawled rarely is worth more engineering time than a low-value page crawled constantly, even though the second one shows up louder in raw hit counts. This is also where partner audit frameworks earn their keep. A structured technical SEO audit built around real crawl data, rather than assumptions, catches issues a surface-level checklist misses entirely.
What Problems Does Log Analysis Reveal, and How Do You Fix Them?
Five issues show up constantly once you start reading logs seriously, and each one has a fairly direct remediation path.
- Redirect chains and loops. Detect these by tracing sequential requests for the same original URL through multiple 301 or 302 hops before landing on a final 200. Fix by collapsing every chain to a single hop from the original URL straight to the final destination, and audit your redirect map quarterly so chains don’t quietly rebuild themselves.
- Crawl budget waste on faceted and parameterized URLs. Internal search results, filter combinations, and session-tracked URLs often account for a huge share of crawl volume. Block low-value patterns in
robots.txt, canonicalize near-duplicate parameter variants, or reduce the internal links that expose them in the first place. - Soft 404s and inconsistent status codes. These hide because the server returns a 200 while the page is functionally empty or broken. Combining status code with response byte size and request frequency flags candidates fast, since a suspiciously small byte count on a 200 response is the tell.
- Orphan pages and under-crawled priority URLs. If your crawl finds a page but your logs show almost no bot visits, internal linking is probably the gap. Add contextual links from high-traffic pages and confirm the URL sits in an updated XML sitemap.
- Server performance hotspots. Response time spikes tied to specific templates or endpoints usually point to a database query, an uncached page type, or a third-party script blocking render. Hand these to engineering with the specific URL patterns and timestamps attached, not a vague “site feels slow” ticket.
Pro Tip: Sort your redirect chain findings by internal link count before you fix them. A chain sitting behind 200 internal links is worth fixing today; one behind three links can wait.
Which Tools Should You Use, Based on Site Size?
For a site under roughly 50,000 URLs, command-line tools plus a spreadsheet get you most of the way there. A pragmatic first pass is a filtered Googlebot audit run with grep, awk, and a pivot table, and you can usually finish it in an afternoon.
Past that scale, spreadsheets choke. Pipe logs into a warehouse like BigQuery or Redshift, and suddenly you can run scheduled queries, track crawl trends month over month, and set alerts when crawl volume to a key template drops sharply.
Dedicated SEO log analyzers (Botify, OnCrawl, JetOctopus, and similar platforms) earn their cost at real enterprise scale. They speed up filtering and segmentation and overlay crawl data automatically, which saves the engineering time you’d otherwise spend building that overlay yourself in SQL.
A sensible pipeline for most growing teams:
- Run a manual CLI audit first to validate that log analysis will actually surface something worth fixing
- Set up scheduled exports once you’ve proven the value
- Move to a warehouse or dedicated tool only when manual review can’t keep pace with your URL count or release cadence
What Should You Check After a Site Launch or Migration?
The first 48 hours after a launch or migration are when logs matter most, because that’s when problems are cheapest to catch. Check for error spikes (sudden jumps in 404s or 500s), crawl-frequency drops on pages that used to get regular bot visits, and redirect churn where bots keep hitting old URLs that should have dropped off already.
Set your monitoring cadence to match risk. Check daily for the first one to two weeks post-launch. Drop to weekly checks once things stabilize. Move to monthly trend reviews once you’re confident the migration held.
Retention stays consistent with your standing policy: keep raw logs for 30 to 90 days, and hang onto aggregated metrics (weekly hit counts, status code trends) far longer since they’re small and useful for year-over-year comparison.
To validate that a fix actually moved crawl allocation, don’t just eyeball the logs once. Re-check the same URL groups a week later and compare against GSC’s crawl stats report for the same window. If both agree, the fix worked.
How a growth engineering partner builds log analysis into a growth engineering roadmap
Log data is only useful when it turns into shipped fixes, not a report nobody actions. Some growth engineering partners treat log analysis as one input into a broader roadmap: pipeline the data, prioritize the fixes by impact, and hand them to the same team already building the site, so redirect cleanup, canonicalization, and internal linking get implemented instead of just diagnosed. This approach often includes helping teams stand up log shipping and ongoing monitoring rather than a one-time audit.
When Should You Actually Prioritize Log File Analysis?
Log analysis earns its place when you’re dealing with real scale, a migration, or stalled indexing on pages that matter. It doesn’t earn a permanent seat on every team’s weekly checklist. Start with a narrow audit, prove it finds something worth fixing, then build the pipeline. The SEO teams that get lasting value from logs are the ones who get their engineers reading the same data, not just the ones with the fanciest dashboard.
— Service
How a growth engineering partner turns log data into shipped fixes
Finding crawl waste in a log file is the easy part. Getting redirect chains collapsed, faceted URLs canonicalized, and internal links rebuilt before the next crawl cycle is where most SEO recommendations stall out inside a backlog. A growth engineering partner may close that gap by having the same team that reads your logs also build the pipeline, ship the fixes, and monitor whether crawl allocation actually shifted afterward.
That means log shipping into a warehouse, a prioritized engineering backlog based on impact times frequency, and monitoring that tracks whether your fixes moved the needle against Google Search Console data, all handled by one accountable team instead of a report handed off to whoever’s free. If your site is large enough, complex enough, or mid-migration enough that logs are the only place the truth lives, request a technical discovery to see where crawl budget is actually going and what fixing it would take.
Sources
For deeper reading beyond this workflow, Search Engine Land’s log file analysis guide covers the fundamentals of request-level data. Ahrefs’ log analysis walkthrough is useful for the collect-filter-cross-reference sequence. Semrush’s log file guide breaks down tool-assisted overlay analysis, and SystemsArchitect’s practical guide is a solid reference for retention and field requirements.
- Log file analysis guide — Search Engine Land
- Server log file analysis for SEO: a practical guide — SystemsArchitect
- How to do an SEO log file analysis — Ahrefs
FAQ
What Is Log File Analysis in SEO?
It’s the process of reviewing your server’s raw request records to see exactly which URLs search engine crawlers requested, when, and what status code your server returned, rather than relying on sampled crawl tools or Google Search Console summaries.
How Long Should You Retain Server Logs for SEO?
Keep at least 30 days of raw logs, with 90 days preferred for meaningful crawl-trend analysis and pre/post-migration comparisons.
How Do You Verify a Request Is Really Googlebot?
Match the user agent string first, then run a reverse DNS lookup on the source IP to confirm it resolves to a Google-owned hostname, followed by a forward lookup to close the verification loop.
What’s the Fastest Way to Start Analyzing Logs Without Expensive Tools?
Run a filtered Googlebot audit using command-line tools like grep and awk alongside a spreadsheet pivot table. This surfaces meaningful findings in hours, and it’s the recommended first step before investing in a warehouse or dedicated analyzer.
Can Log Analysis Help After a Site Migration?
Yes. Logs show whether crawlers actually found your new URLs and stopped requesting old ones, which is direct evidence a migration crawl tool or GSC alone can’t confirm at the same level of detail.